| Bicycling Life |
About Our Site
Issues & Editorials
Solutions for Little
Problems,
Adjustments, and Repairs.
Using Bikes in Everyday
Life
Commuting & Errands
Cycling for Fun &
Health
Street Smarts for Bicyclists
Safety Issues
Advancing Cycling Issues
Getting Involved
Position Papers
Research and
Source Documents
|
| |
|
  Stepping
Stones to a Better Cycling Future Stepping
Stones to a Better Cycling Future
|
A presentation by Malcolm Wardlaw to the combined British CTC/CCN
conference in Chesterfield, England on 13th October 2001.
Appears here on BicyclingLife with permission of the Author.
Editors Note: Throughout this article you will
find embedded images of the PowerPoint(tm) slides used
during Mr. Wardlaw's presentation. These have been reduced to fit the
web browser display and readability has suffered somewhat. If
you click on the slide image, it will be presented full screen.
Then you may use your browser's Back button to return to the
paper.

|
A most important point to emerge
from my analysis for this presentation was the increase in
road danger that has occurred as a direct consequence of the "dangerising"
of cycling.
Here in Britain, the Nineties saw a precipitous fall in cycling by
young adults. This is not surprising, since a generation is growing
up indoctrinated to believe that road riding is dangerous. Instead,
the young are encouraged to drive. Result: more young adults killed
in car crashes and many more other road users killed by young
drivers.
Malcolm Wardlaw
|
In the last issue of Cycle Touring & Campaigning magazine [1],
there was an excellent article by John Stuart Clark, which I think did
an outstanding job of summarising the problems we are facing in
cycling at the moment. He concludes:
"Maybe now that Britain has reached a junction where our
cycling culture has become as impoverished as Americaís,
manufacturers will wake up. For campaigners and planners, it is
clearly time to shift the spotlight from the hardware of
infrastructure to the software of minds. For mainstay cyclists, we
have a responsibility to proselytise at every opportunity. How I would
like to give Max Clifford the brief to raise the awareness of cycling
in Britain, to see what he could come up with."
That says it all beautifully. In this talk, Iím going to review
some of the facts about cycling that I have gathered from official
sources. It is possible that some of the results will surprise you. Iíd
like to think that I can persuade you there are messages in these
statistics that we should be using far more forcefully in building our
case for a better cycling future.
What is known?

Click image to enlarge
Before I get into that, I first need to say something about the
information that is available. We can be pretty sure that figures for
the number of people killed in crashes are reliable, but on the other
hand, how confident can we be about estimates of the number of
kilometres cycled in Britain each year? The official estimate is just
over 4 billion kilometres. The statisticians make a big grab by
gathering data at 16,000 count sites around the country. They have
been doing that since 1949, so thereís plenty of scope for looking
at long term trendsÖ.. That is a lot of counting, but, there is a
good deal of cycling on urban backstreets and country lanes that gets
missed. It is far more likely that figures for cycling are
underestimated rather than overestimated. When we calculate risk, we
thus get a pessimistic result. This should be borne in mind.
Similarly, how do you find out how much cycling is done by (for
instance) teenage boys? Itís not easy! The National Travel Survey
has been ongoing since the early Seventies and is based on interviews
with 8,000 individuals per year to build up information on personal
travel that may be split by age group and by mode of transport.
Unfortunately young males are notoriously uncooperative in this
exercise, and most cyclists are young malesÖ. Again, there will be
some bias in the data.
It should be understood that the amount of information on cycling
available in Britain [2][3] is
much greater than in most other countries. In the USA and Canada, data
on cycling are virtually non-existent. This stepping-stones approach
is only possible because the information was collected and made freely
available. In other countries, campaigners are not so lucky.
The safety of cycling in Britain
Click image to enlarge
Dangerous and safe activities

Click image to enlarge
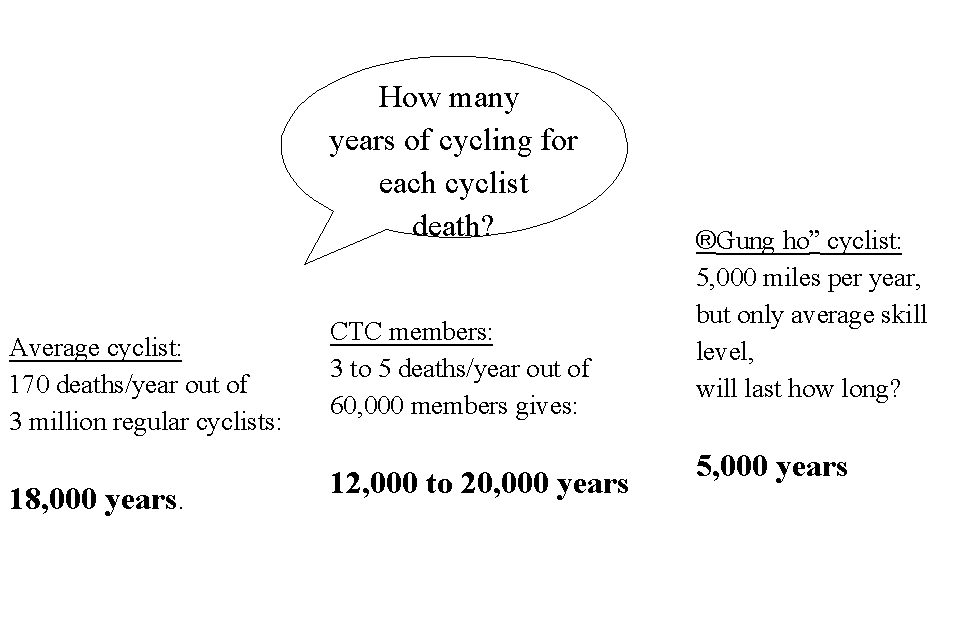
How dangerous is cycling? A quick-cut measure to put the risk in
day-to-day terms is to calculate how many years of cycling there are
for each death. To put it another way, this is the number of years you
could expect to cycle before being killed in an accident. We know that
currently about 170 cyclists get killed per year and from surveys we
know there are about 3 million regular cyclists in Britain. There are
in addition at least another 3 million occasional cyclists, but we
will ignore them here. We divide 3 million by 170 to get:
18,000 years.
Now that looks like quite a lot of cycling. The average cyclist in
Britain is not very active, however, using their bike for just two
hours per week. A more useful measure of the risks for active cyclists
is to look at CTC members. There are 3 to 5 deaths per year, out of
60,000 members, so that gives:
12,000 to 20,000 years.
Again, that is quite a lot of cycling. Even if we stick with the
lower figure of 12,000 years, that is a very long time. 12,000 years
ago there were still no cities at all, so such a time spans the entire
ascent of human civilization! So it looks like CTC members face a risk
per hour that is much lower than the average. We might put together a
very pessimistic scenario of the "gung-ho" cyclist, who
rides for more than an hour every day, covers around 5,000 miles per
year, yet still faces the same risks as the average rider. Even this
individual may expect 5,000 years of cycling before a fatal crash.
That means, if Iíd set off about the time theyíd built the Great
Pyramid and ridden 5,000 miles per year, century in and century out,
it would only be now that Iíd be in line for getting killed.
By any sensible, everyday standard, normal road cycling is a
low-risk activity, even here in Britain where, as we are well aware,
casualty rates are higher than they are in other countries. Leisure
and utility cycling are low-risk activities and they should rightly
have the public image of being safe activities. That is what the
evidence tells us.
Opposites donít attract
Click image to enlarge
Having got you believing that, I will now tell you that if I carry
out a paper exercise and draw on official statistics to calculate
average hourly risks of death for cyclists and drivers in Britain,
cycling comes out as being several times riskier. That does not make
it dangerous, as we saw; if you take a small risk and multiply by 3.5,
itís still a small risk.
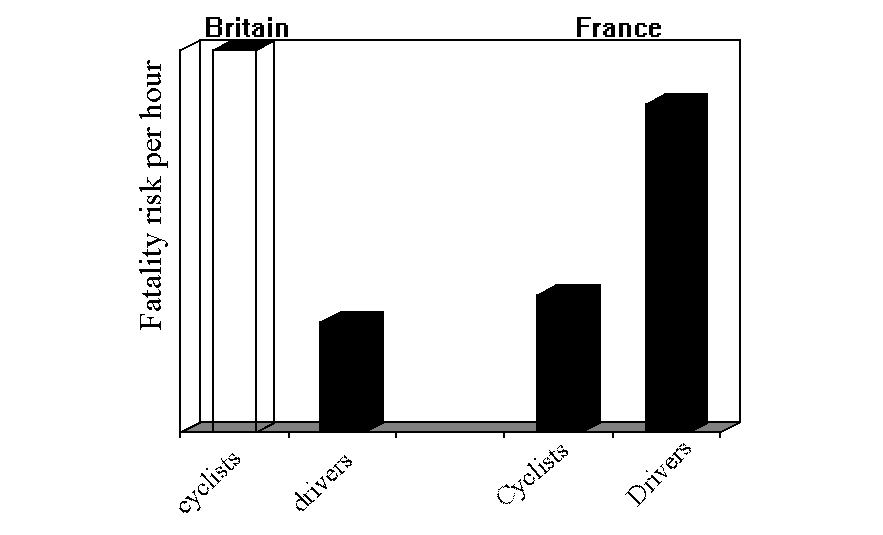
It is interesting to compare circumstances here in Britain with
those in France [4]. Now isnít that interesting? In France, an hour
of cycling is much safer than an hour of driving - not perhaps such a
huge surprise to those who have cycled and driven in France! In fact,
the risks for French drivers are about the same as for British
cyclists, while the risks for British drivers are about the same as
for French cyclists. The French drive the same cars we do and ride the
same bikes, and like us they pursue the tradition of vehicular
cycling. It is quite wrong to assume that cycling will inevitably be
more dangerous than driving, just as it is wrong to believe that
bicycles and cars cannot safely share road space. There must be
competence and respect on both sides. When those conditions are met,
it can happen.
Cycling and driving in various countries

Click image to enlarge
If we take a general sweep across countries for which there are
available data [5], we find there is a wide spread of risks for
driving and for cycling. It may surprise many to discover that in most
countries there is not much difference in risk compared on an hourly
basis. There are a few countries where cycling is clearly safer than
driving, and there are a few where cycling is clearly riskier than
driving. Britain falls into the latter category. In fact, there is no
other industrialised country where there is such a large difference in
risk between cyclists and drivers.
There is nothing to suggest that cycling is in any consistent way
more dangerous than driving: it all depends on local conditions and
attitudes. If we define an upper risk bracket, we find French drivers
with British cyclists. At the lower risk bracket we find British and
Swedish drivers with French, Dutch, Danish and Swedish cyclists. But
they all fit pretty much into the same range. We can confidently
dispose of the myth that cycling is more dangerous than driving in any
systematic way.
We need to be aware that the situation we face in Britain is a
unique one. A fine record for drivers is juxtaposed with a poor one
for cyclists. So on paper, we have further to climb than other
countries.
Existing agenda is making things worse.
Click image to enlarge
As if that insight is not daunting enough, just to add insult to
injury, current policies seem to be making things worse rather than
better. A review of fatality rates (risk of death per kilometre) for
different road users during the Nineties shows that cyclists did not
share the improved trends enjoyed by pedestrians and car users. We see
that the Nineties split into two phases. In the first phase up to
1994, the fatality rate for cyclists declined in smooth progression
with pedestrians and car users. This is what we would expect, since
fatal crashes have a common cause: motor vehicle impact speeds. If
impact speeds fall, say, as in this case, because of economic
recession, then all road users gain equally because impact speeds fall
for all types of crash.
However, after 1994, there was an excess of cyclist deaths which
led to a regression of safety through the second half of the Nineties.
If you look closely, you will notice that the fatality rate in 1999
was higher than it had been in 1994. It is highly unusual for a single
group to suffer such a regression. In the whole injury record back to
1970, the only similar such increase in cyclist deaths was caused by
the seatbelt laws of 1983, which also changed the trends for car users
[6]. Why did cyclists alone suffer this sharp regression?
All we can say is that something within the world of cycling went
wrong such as to cause a relaxation of caution. It is clearly time to
review every policy that was put into force during the Nineties.
Indeed, it is all too clear that we have reached stagnation if not
worse. This is where the stepping stones begin.
Stone One: the secret of the average.

Click image to enlarge
Some years ago, the Transport Research Laboratory carried out a
detailed comparison of the risks of cycling, walking and driving in
Britain [7]. This analysis revealed a most
interesting pattern when the risk was broken down by age group.
This is a classic case of the average revealing and yet concealing.
Even here in Britain, there is an age group for which the risks of
cycling and driving are not much different. 17-24 year olds are not
significantly more at risk cycling than driving, but when cycling they
are drastically less danger to others. Getting this group out of cars
and onto bikes would be an entirely risk-free measure that would also
cut road danger as effectively as campaigns against drinking and
driving. That is our first stepping stone. Getting more young adults
to cycle really will mean less danger.
Notice that for most other age groups, the risks are not as high as
the average would suggest. There is just one group that has an
alarmingly bad safety record, and that is the 40-60 year age group. We
have no information as to why this group should have a problem, but we
can see that this group jacks up the average for everyone else. For
British adults in the age range 17 to 40, the risk in cycling is
hardly out of line with the EU average for drivers.
Stone Two: cyclists donít kill.
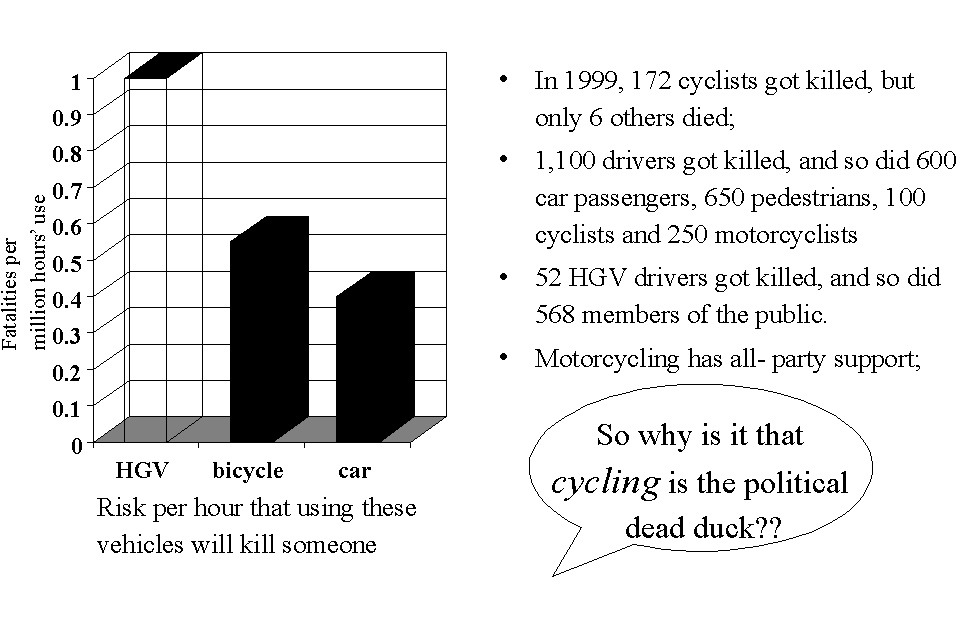
Click image to enlarge
Those who focus only on cyclist versus driver risks are apt to miss
that cycling is a benign mode of transport. There were 172 cyclists
killed in 1999, but only 6 other road users were killed in crashes
involving a bicycle. By comparison, there were 1,100 drivers killed,
but 1,600 other road users were killed in crashes involving cars. The
reason is obvious enough: car crashes are far more violent than
bicycle crashes. To the 1,100 drivers must be added 600 passengers,
650 pedestrians, 100 cyclists and 250 motorcyclists. From the
viewpoint of the policy maker weighing the merits and drawbacks of
different modes of transport, it matters that the bicycle is so
unlikely to inflict serious harm on others. If we apply available
information to calculate the risk per hour of different vehicles
causing fatal injury to any road user (see [2] and
[3]), we find that
even in Britain, where the user risks are so apart, most of the
difference between bicycle and car disappears.
If we add heavy goods vehicles (HGV) to the picture, we are struck by how
great a threat they represent to others. In 1999, 52 drivers were
killed, but 568 members of the public were killed too. That is a
scandalous imposition of danger on the public - and the issue has no
political profile. The use of HGVs is currently increasing faster than
for other classes of vehicle, yet when did you last hear a Minister
for Transport say: "More lorries mean more danger."? The
promotion of motorcycles also has all-party support, yet motorbikes
are four times more dangerous to pedestrians than cars and more than
ten times more dangerous to riders than bicycles. There is clearly no
rationale whatsoever behind the political treatment of different types
of vehicle.
Even so, one does have to ponder: given all the pressures to
increase exercise, reduce danger, pollution and congestion, why is it
that the promotion of cycling is a political dead duck?
This ainít no sensible world.
Stone Three: the Growth Rule.

Click image to enlarge
Consider these two facts: 0.8% of road travel is by bicycle; 5% of
road deaths are cyclists. It is silly to conclude that if 16% of road
travel were by bike, 100% of road deaths would be cyclists. But that
is exactly what the DTLR does assume when it is estimating the effects
of increased cycling.
It is clear enough that the main reason the risks of cycling are
higher here in Britain than elsewhere is simply that there are not
enough cyclists on the roads. If there were more cyclists, cycling
would get safer - and thatís a mathematical certainty, as we saw
above. The official view follows the comfortable simplicity that if
you quadruple the amount of cycling youíll quadruple the number of
deaths. Is there evidence of a more realistic alternative
relationship?
Yes. Time to meet the Growth Rule.
I must make it clear that the Growth Rule is not my original
observation. It was first noticed by Scandinavian researchers a couple
of years ago [8]. Their work was pointed out to me
by an American called Peter Jacobsen, who had read my British Medical
Journal paper and
had further tested the Growth Rule in Californian and Danish cities
and found it to hold true. My work has been to apply the Growth Rule
to several countries in Europe to see how it held up.
The Growth Rule states that if the amount of cycling doubles, the
number of deaths increases only 25%, hence the risk in cycling
decreases by 37%. If the amount of cycling quadruples, deaths increase
by 60% while the risk goes down by 60%. If the Growth Rule is right,
fulfilling the National Cycling Strategy would lead to an increase in
deaths from 170 to 270 - and there is reason to believe that most of
these extra deaths would be cancelled by reduced deaths in other
groups. That sounds pretty dramatic, but how reliable is this Growth
Rule?
Letís put it to the test. Letís first see how the Growth Rule
holds up explaining the variation in cyclist death rates across Europe
that we found in our earlier survey.
The Growth Rule on test across Europe.

Click image to enlarge
There isnít much to say. Iíve made Denmark the basis for the
comparison, and arranged the countries from there in descending order
of cycle use down to Italy. A complication in this comparison is that
attitudes to risk vary from country to country. What we really want to
know is how a given level of cycling relates to a given %age of road
deaths that are cyclists. So I calculate a dimensionless fatality
rate:
(cyclist deaths as a %age of all road deaths)
Adjusted fatality rate =
------------------------------------------------------
(per capita cycling as a %age of Denmarkís)
Take Britain as an example. Here, cyclists were 5% of road deaths
in 1990 (the last year for which comparative figures are available),
while the amount of cycling per person was 8% of Denmarkís. So the
adjusted fatality rate is 5/8 = 0.625. The Growth Rule predicts a
slightly pessimistic value of 0.76, but that is close, bearing in mind
we are comparing countries with a 12-fold difference in cycling
levels!
There is a fair amount of scatter on the chart. Much of the scatter
will be due to different traditions of measuring cycling in different
countries. The Growth Rule line is virtually a best-fit through the
scatter, quite an impressive performance!
The Growth Rule on test across time.

Click image to enlarge
Another test for the Growth Rule. According to the long term
traffic census, there has been a good deal of change in the amount of
cycling in Britain over the last thirty years. There was a period of
strong growth in the Seventies peaking around 1983, after which there
was steady decline back down to the same level as in 1970 currently -
progress!
There is a complication here, because the overall number of road
deaths has fallen by more than half since 1970, and this will have had
some kind of effect on cyclist deaths. But what is the relationship?
Weíre lucky in that the amount of cycling was about the same in 1999
as it was in 1970. This means we can compare the two years without
fear of any "growth effect" confusing the answer. From 1970
to 1999, all road deaths fell from 7,500 to 3,400 (-56%), while
cyclists deaths fell from 385 to 170 (-57%), so it looks like cyclist
deaths fall in proportion with overall road deaths. This is not a
surprising result, if one subscribes to the view that road deaths are
controlled primarily by behaviour, rather than technical measures. In
applying the Growth Rule, the proportional relationship was assumed.
Comparing what actually happened with what the Growth Rule predicts
leaves little to say, beyond that the Growth Rule model gets it dead
right. If anything, it underestimates the benefits of the growth in
cycling during the Seventies. It is particularly important to
understand that the Growth Rule applies in the absence of any special
measures to provide special infrastructure for cyclists. Clearly
during the Seventies there was no effort to cater for cyclists, who
pursued the tradition of vehicular cycling, and derived strong
benefits from their increased presence in the traffic.
There is an ironic story behind the Growth Rule. The researchers
who first observed it in Sweden were studying the effect of altering
the design of cycle path crossings at segregated junctions. They found
that the engineering measure brought no net benefit - indeed, they
concluded, as usual, that cyclists fared best on the road with motor
traffic - they saw instead that there were inherent benefits from
increased cycling.
Although we do not as yet know why the Growth Rule is so universal,
we can be pretty sure it is real. You have seen it before your eyes
here, others have detected it in Sweden, Denmark and California, not
just for cyclists, but for pedestrians too (publication by Jacobsen is
pending).
The Growth Rule is the third of our stepping stones. It provides us
the ultimate argument for the promotion of cycling; more cycling means
safer cycling. End of argument.
Better marketing = safer cycling.

Click image to enlarge
We have come full circle back to the article by John Stuart Clark.
"It is clearly time to shift the spotlight from the hardware
of infrastructure to the software of minds."
We know from surveys that there is plenty of suppressed demand for
cycling, and we want an increase in cycling to improve safety. So why
isnít it happening? The problem is brand image - the "cycling
is dangerous" tag. That deters new cyclists and it kills
political interest, since it is assumed any promotion of cycling will
necessarily involve unpopular restraint of driver behaviour. And we
canít deny that at least in part we have done our bit to create the
"cycling is dangerous" myth, through attacking drivers to a
degree far beyond reason. Just to make things more complicated, some
cyclists have identified the bicycle with extreme politics and
fundamentalist hostility to the motor car, and indeed, to industrial
civilisation. This is ironic, bearing in mind that the safety bicycle
was invented by James Starley, who was a capitalist, and later founded
the Rover car company. The real price of a bicycle has fallen by 90%
over the last century only because of the more efficient methods of
scale production that spun off from much larger industries.
A consumer society is made up of busy people with too many choices.
We are all, whether we recognise it or not, conditioned by consumerism
to make snap judgements based on brand image. Any marketing executive
will tell you that brand image is a self-fulfilling prophecy -
substance has nothing to do with it. Soft drinks are sold on the
strength of positive messages about physical fitness and belonging to
the cool group; they wouldnít sell on messages about tooth decay and
the importance of regular brushing. It is brand image that pushes
action in a consumer society.
If there is going to be a cycling revival, we have to destroy the
old myths and create a new brand image for cycling - based on the
facts. Destroy the myth that cycling is dangerous and you destroy the
other myth that pro-bike equals anti-car. The bike will sell on its
strongest points:
;
Healthy;
Quick.
No lie in any of that, especially pushing it at the 17-24 age
group. Put the facts in a positive instead of negative light.
The logic path is clear enough. To make cycling safer, we must make
it more popular; to make it more popular, we have to rebuild its image
as something attractive that people will be drawn to getting into.
Brand image is a self-fulfilling prophecy.
Changing the software of minds.
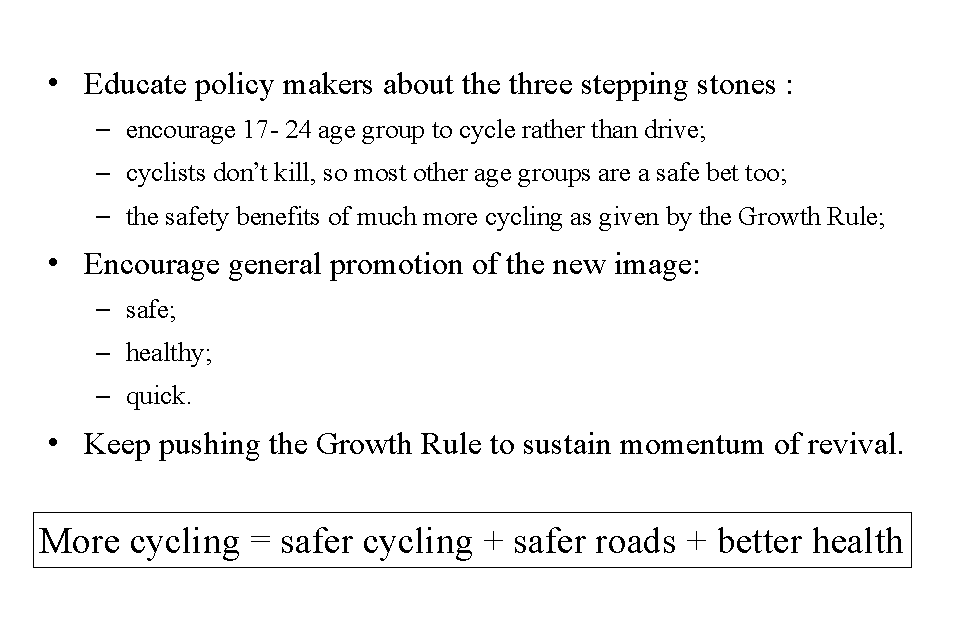
Click image to enlarge
If I were putting together an action plan for a cycling revival,
these would be my main points:
- Educate local government, the medical establishment and the
road safety establishment about the three stepping stones:
- encourage 17-24 age group to cycle rather than drive;
- cyclists donít kill, so most other age groups are a safe
bet too;
- the safety benefits of much more cycling as given by the
Growth Rule.
- Also gather more backing from enlightened public health
professionals;
- Encourage existing cyclists to support the new image - safe,
healthy, quick;
- Keep pushing the Growth Rule message to sustain momentum of
revival.
References
Clark JS. Transport or Toy? Cycle Touring
and Campaigning Oct/Nov 2001.
Department for Transport, Environment and
the Regions. Road accidents in Great Britain; the casualty
report 1999. London: The Stationery Office 2000.
The Office of National Statistics. The
national travel survey 1994/96. TSO Publications, London: The
Stationery Office 1997.
Carrť J-R. La situation de la bicyclette en
France. In: Boivin R, Pronovost J-S, eds. The bicycle:
global perspectives. Proceedings of the Velo Mondiale Conference,
Montreal, 1992.
Hydťn C, Nilsson, Risser R. WALCYNG -
how to enhance WALking and CycliNG instead of shorter car trips
and to make these modes safer. Instititionen fŲr Trafikteknik,
Lunds Tekniska HŲgskola, Bulletin 165, 1998.
Richens J, Imrie J, Copas A. Condoms and
seatbelts, the parallels and the lessons. Lancet
2000;355(9201):400-3.
Morgan JM. Risk in cycling. Transport
and Road Research Laboratory working paper WP/RS/75. Crowthorne:
TRRL 1988.
Leden L, GŚrder P, Pulkkinen U. An expert
judgement model applied to estimating the safety effect of a
bicycle facility. Accident Analysis and Prevention
(2000);32:589-99.
|
  |
|