familygreen2.gif (5638 bytes)

wpe6.jpg (9625 bytes)

  A Web-site for Everyday Bicyclists.

Page One Site Map FAQs About
  Bicycling Life

Page One

About Our Site

News And Views

Issues & Editorials

Bicycling "How-To"s

Solutions for Little Problems,
Adjustments, and Repairs.

Practical Cycling

Using Bikes in Everyday Life
Commuting & Errands

Touring & Recreation

Cycling for Fun & Health

Safety Skills

Street Smarts for Bicyclists
Safety Issues

Effective Advocacy

Advancing Cycling Issues
Getting Involved

Library

Position Papers
Research and
Source Documents

Links


Bicycle Vs Auto Production


By Riley Geary

The 1996 edition of Vital Signs published by the Worldwatch Institute
contains some interesting production figures for both bicycles and automobiles
over the past 30+ years (all numbers in millions):

wpe3.jpg (26587 bytes)


Year

Bikes

Autos

Auto Fleet

1950

11

8

53

1955

15

11

73

1960

20

13

98

1961

20

11

1962

20

14

1963

20

16

1964

21

17

1965

21

19

140

1966

22

19

148

1967

23

19

158

1968

24

22

170

1969

25

23

181

1970

36

22

194

1971

39

26

207

1972

46

28

220

1973

52

30

236

1974

52

26

249

1975

43

25

260

1976

47

29

269

1977

49

30

285

1978

51

31

297

1979

54

31

308

1980

62

29

320

1981

65

28

331

1982

69

27

340

1983

74

30

352

1984

76

30

365

1985

79

32

374

1986

84

33

386

1987

98

33

394

1988

105

34

413

1989

95

36

424

1990

94

36

445

1991

100

35

456

1992

103

35

470

1993

109

34

469

1994

107

36

480

1995

107

36

477

1996

99

37

486

1997

94

38

498

1998

38

508

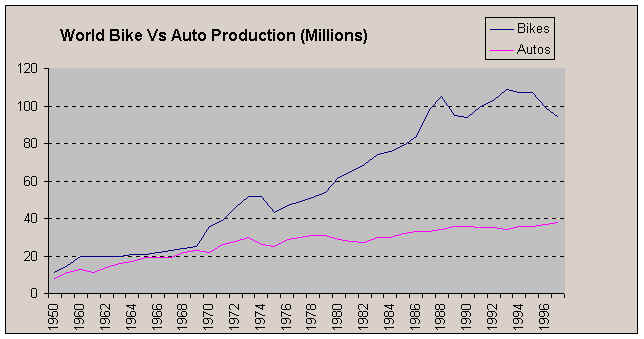
As can be seen from the chart, global automobile production very nearly caught up with bicycles in terms of total numbers by the late 1960's, but since then bicycle production has far outstripped that of automobiles and currently stands at about a 2.5 to 1 ratio (down somewhat from the 3 to 1 ratio of the early 1990's).

So while bike sales may be steady or declining in America over the past few years, they continue to make enormous gains in other parts of the world -- particularly Asia where China alone, until this most recent downturn, had been producing more bikes than all the world's automotive output combined.

Despite a 21% drop in 1997 to 30 million units, China is still far and away the world's leading bicycle manufacturer, with Taiwan at 11.9 million and India at 11.5 million following. Note also that while the global automobile fleet has expanded from less than 200 million to just over 500 million since 1970, during that same time well over 2 *billion* bicycles were produced.

TN01223_.WMF (4580 bytes)


Home About This Site Email the Editor Submissions Sponsors
08/16/11
Copyright © 1999 Bicycling Life Website.